Have you started on your fitness journey yet? Then you’re probably using a smart scale to monitor your progress. However, accurate weight loss tracking is beyond knowing how much you weigh.
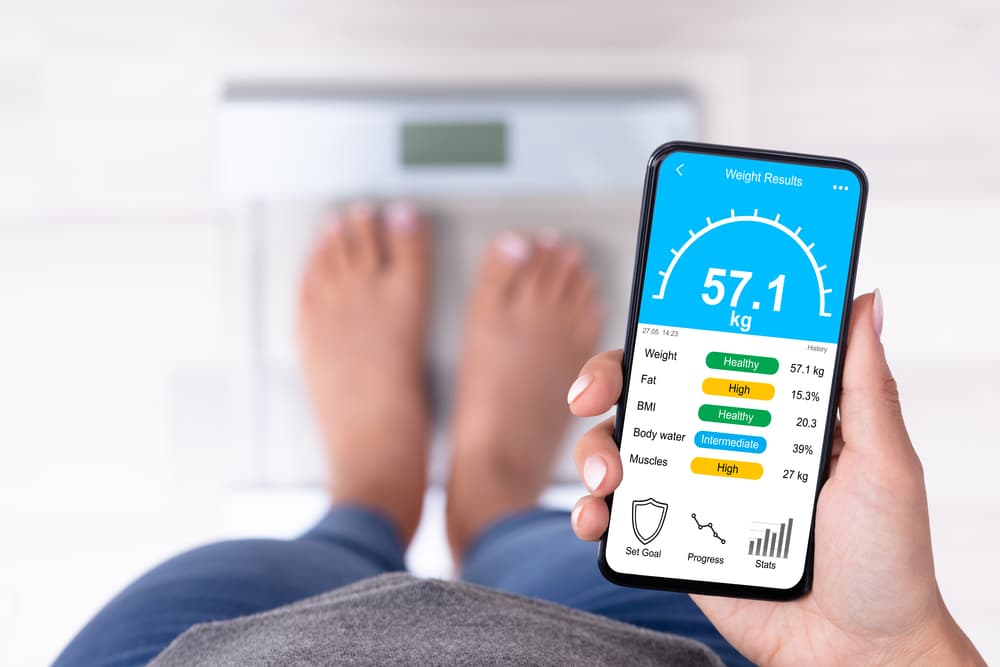
You see, digital scales can provide more detailed body composition data of your overall health status. But the question is, what do these figures mean?
To help you out, here’s a list of body metrics relevant to your fitness loss goals.
Read on to understand how these can help direct you towards a healthier track!
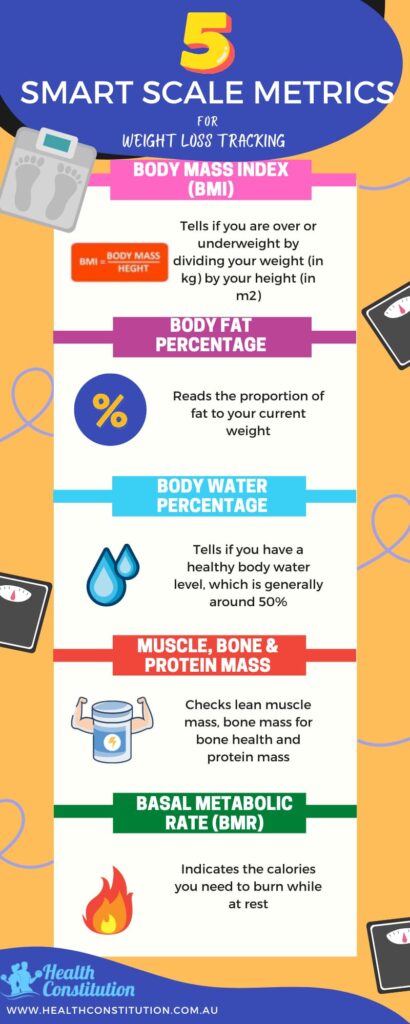
1. Body Mass Index (BMI)
Stepping on any digital body weight scale will tell you how much you weigh.
But that number doesn’t consider your height. It does not give you an accurate picture of whether your weight is ideal for your build or not.
That’s why knowing your BMI is essential for weight loss tracking.
This metric can tell if you are over or underweight by dividing your weight (in kg) by your height (in m2).
Your smart scale can instantly compute this for you. You can do it manually, too. There are also BMI calculators online.
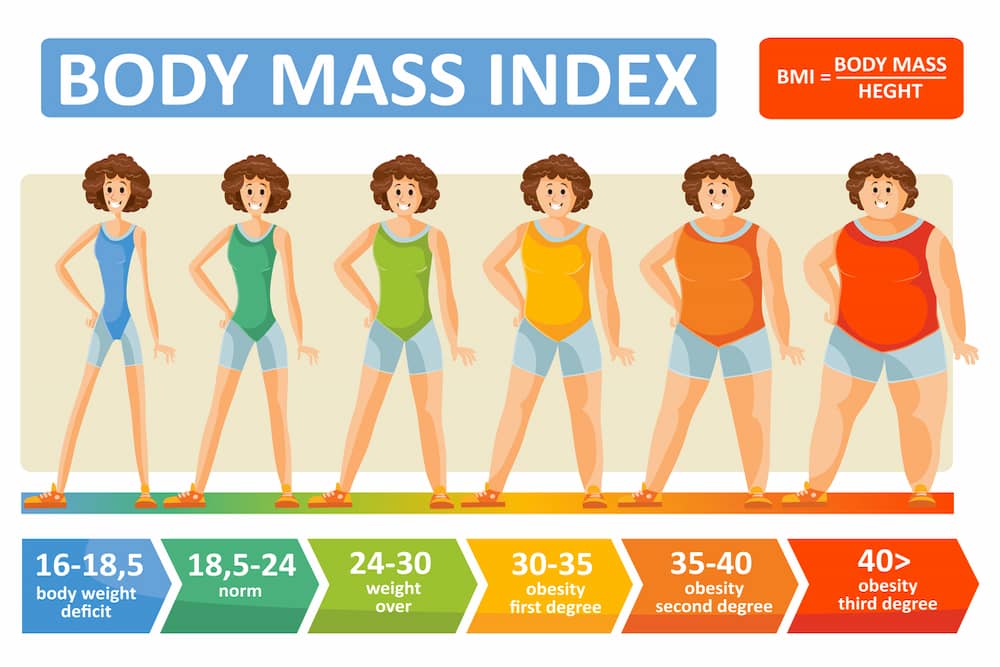
Here’s an infographic showing the BMI ranges and interpretation according to the Australian Government Department of Health.

BMI may give you direction on how to achieve or maintain your ideal weight.
However, it does not measure body fat mass. And so, BMI should not be your sole indicator for weight loss success.
Women, the elderly and Asians, for example, have a higher body fat percentage, which affects BMI reliability.
Athletes, too, may have high BMIs due to their enhanced muscles.
2. Body Fat Percentage (BFP)
The proportion of fat to your current weight is another vital health metric for weight loss tracking.
And there are several ways to get it, including 3D body scans, specialised X-rays and a skinfold calliper.
Like BMI, you can compute it manually or through body fat calculators, too.
But the easiest method would be stepping on a digital bathroom scale with bioelectrical impedance analysis.
There are several factors that can affect your BFP, though, like your age, lifestyle and gender.
Body fat naturally increases as we grow older, for example. And women generally have higher body fat levels than men.
To give you an idea, here are the healthy body fat guidelines for men and women. Note that athletes may have lower BFP due to their lean body mass.
| Age | Women | Men |
| 20 to 39 | 21% to 32% | 8% to 19% |
| 40 to 59 | 23% to 33% | 11% to 21% |
| 60 to 79 | 24% to 35% | 13% to 24% |
On top of making weight loss tracking more precise, BFP alerts us of several health risks.
A low BFP, for instance, signals potential organ damage.
On the other hand, a high BFP indicates obesity and cardiovascular health issues.
3. Body Water Percentage
Like fat, water also contributes to our actual weight. However, this weight loss tracking metric is not only about the water you need to gain or lose.
It’s also about staying hydrated to perform various activities related to losing weight.
For example, water is crucial in lubricating our joints and protecting our spine.
That way, we can do our chin-up bar or dumbbell exercises without hurting ourselves.
Water is essential in sweat, respiration and stable body temperature, too. It also helps in metabolising and transporting nutrients from the food we eat.
Water weight varies depending on your age and gender. You can check it using the Watson formula or your digital bathroom scale.
A healthy body water level is generally around 50%.
Anything lower than that means you need to drink more fluids to avoid dehydration and other health risks.

4. Muscle, Bone and Protein Mass
As I’ve said earlier, weight loss tracking is not limited to BMI. That’s because this indicator does not take your lean muscles and fat into account.
Now, muscle mass is just as essential as fat percentage.
You see, muscles are heavier than fat, which naturally increases your body weight.
However, the more muscles you have, the more calories you burn at rest.
Moreover, muscle development also leads to a healthier figure.
Here’s a guide on normal ranges for muscle mass.
| Age | Women | Men |
| 20 to 39 | 63% to 75.5% | 75% to 89% |
| 40 to 59 | 62% to 73.5% | 73% to 86% |
| 60 to 79 | 60% to 72.5% | 70% to 84% |
The bones in our body are also essential in weight loss tracking. After all, we need healthy bones to exercise.
Our calcium levels indicate bone density and strength. And healthy bone mass is about 2.5% to 4% in women and 3% to 5% in men.
Low bone mass (osteopenia) does not show obvious symptoms.
That’s why using a digital scale to check this health metric is crucial for risk assessment and immediate remedy.
On the other hand, protein mass should be 17% or more in the body. If it’s lower than this, your boy may be high in fats.
So, make sure you have enough protein, ideally around 12% to 20%, in your daily calorie intake.
5. Basal Metabolic Rate (BMR)
BMR is yet another crucial weight loss tracking metric. It indicates the calories you need to burn while at rest.
Yes, even when you’re doing nothing, your body continues to work.
And it allocates about 70% of your total calories to metabolic functions like breathing, blood circulation and cell growth.
This fact further stresses that drastic dietary changes to lose weight is not good.
So, use your BMR results to design a diet plan with sufficient calories.
Specifically, normal BMR is approximately 5900kJ/day for average women and 7100kJ/day for men.

How Do I Improve My Body Composition Metrics?
Start with these simple tips to get better numbers throughout your weight loss tracking journey.
Better BMI and BFR
- Adjust your processed carbohydrate and sugar intake.
- Always stay hydrated and get enough sleep.
- Do low to moderate levels of activity.
Better Body Water Percentage
- Drink enough fluids according to your age, sex, activity level or pregnancy/lactating state.
- Steer clear of alcoholic, caffeinated or sweetened drinks.
- Eat whole fruits and vegetables to increase hydration level and fibre intake.
Better Bone Mass
- Include vitamin D and calcium-rich foods in your diet.
- Do weight-bearing exercises like aerobics, walking on a treadmill or elliptical training.
Better Protein/Muscle Mass and BMR
- Include whole protein sources, like eggs, dairy and red meat, in every meal. Vegan options like tofu, nuts, lentils and seed are excellent, too.
- Do compound exercises with a power rack or resistance bands to target multiple muscle groups.
Takeaway
There are a few points we need to understand about weight loss tracking. First, it’s not all about your actual body weight.
Our weight comprises several body components. All of which need to be at the ideal levels to efficiently lose weight.
Second, your weight loss is only successful if you balance your food and fluid intake.
Your health goal is not only to burn calories but also to do it the right way.
And finally, a smart scale makes it easy to track the numbers and incorporate a more holistic approach to your health objectives!
Do you think a smart scale can help with your health journey? Learn more about this fitness device from my reviews and buying guide.

- Foldable vs Traditional Reformers: Which One’s Right for You? - 2 July 2025
- Elliptical Cross Trainer vs Exercise Bike: Which is Better? - 24 June 2025
- How Do the Different Massage Gun Attachments Work? - 23 June 2025
